

Bonjour,
Je ne suis pas un féru de PHP, et j'ai besoin d'un peu d'aide
contexte :
J'ai une station météo dont je prend des données toutes les 5 minutes que je stocke dans un fichier de 3 jours (nommé "meteo_72h.dat")
Chaque ligne a cette apparence : « 2020-10-18 12:45|1024,5|13,2|91|0|0|2|NE| 14|4,8 » où les données sont séparées par un « | »
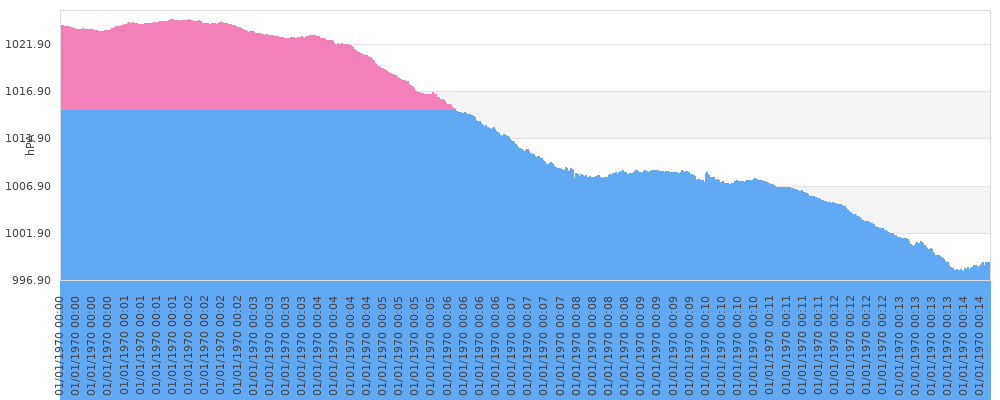
Je m'intéresse ici au deux premières (faut bien commencer), la date et la pression atmosphérique. Je voudrais les voir représentées en histogramme à barres cumulées : les basses pressions (<1015) en bleu et au-dessus, (éventuellement) les hautes pressions en jaune.
Résultat :
Le graphe a l'allure que j'espérais, mais pas les couleurs, ni les dates.
Vous pouvez trouver un fichier "meteo_72h.dat" là : https://www.dropbox.com/s/1ks8dd5xhy...o_72h.dat?dl=0
Merci d'avance pour vos pistes,
Code PHP:<?php
require_once( '../jpgraph/jpgraph.php' );
require_once( '../jpgraph/jpgraph_bar.php' );
require_once( '../jpgraph/jpgraph_date.php' );
setlocale( LC_ALL, 'et_EE.ISO-8859-1' );
$ws_pr_x = 0; // pression maX
$ws_pr_n = 9999; // pression miN
$Fichier = file( 'meteo_72h.dat' );
for ( $i = 0; $i < 864; $i++ ) {
$data = explode( "|", $Fichier[ $i ] );
/*
0 date et heure
1 pression
2 temp
3 hum
4 rain
5 rain rate
6 direction du vent en chiffres
7 idem en lettres
8 vent
9 rafales
*/
// stockage dates et heures et minutes
$ws_dt[ $i ] = strtotime($data[ 0 ]); // ????
// stockage pressions
$data[ 1 ] = str_replace( ",", ".", $data[ 1 ] ); // remplace les virgules par des points
// Détermination des pression min et max
if ( $ws_pr_x < $data[ 1 ] )$ws_pr_x = $data[ 1 ]; //pression maX
if ( $ws_pr_n > $data[ 1 ] )$ws_pr_n = $data[ 1 ]; //pression miN
// création des séries, la première, $ws_prb, pour les basses pressions, limitée à 1015 ; la seconde, $ws_prh, pour les hautes pressions
if ( $data[ 1 ] > 1015 ) {
$ws_prb[ $i ] = 1015;
$ws_prh[ $i ] = $data[ 1 ] - 1015;
} else {
$ws_prb[ $i ] = $data[ 1 ];
$ws_prh[ $i ] = 0;
}
} // fin de la lecture du fichier
//fclose( $Fichier ); // On ferme le fichier // BEUGUE !
//---------------------------------------------------------------------------
if ( $ws_pr_n > 1015 ) {
$ws_pr_n = 1015;
};
$ws_pr_n -= 1;
$ws_pr_x += 1;
// Create the graph. These two calls are always required
$graph = new Graph( 1000, 400 );
$graph->SetScale( "datlin", $ws_pr_n, $ws_pr_x ); // échelle de date, min et max en y
//$graph->SetShadow();
$graph->img->SetMargin( 60, 10, 10, 120);
// Create the bar plots
$b1plot = new BarPlot( $ws_prb );
$b1plot->SetFillColor('blue');
$b2plot = new BarPlot( $ws_prh );
$b2plot->SetFillColor('yellow');
// Create the grouped bar plot
$gbplot = new AccBarPlot( array( $b1plot, $b2plot ) );
// Set the angle for the labels to 90 degrees
$graph->xaxis->SetLabelAngle( 90 );
$graph->xaxis->SetPos( $ws_pr_n );
// The automatic format string for dates can be overridden
$graph->xaxis->scale->SetDateFormat( 'd/m/Y H:i' );
$graph->xaxis->scale->SetTimeAlign( DAYADJ_1 );
//transparence
//$graph->SetFrame(true,'black:0', 1); // PAS PRIS EN COMPTE !
//$graph->img->SetTransparent('black');
// ...and add it to the graPH
$graph->Add( $gbplot );
//$graph->xaxis->title->Set("X-title");
$graph->yaxis->title->Set( "hPA" );
//$graph->title->SetFont( FF_FONT1, FS_BOLD );
//$graph->yaxis->title->SetFont( FF_FONT1, FS_BOLD );
//$graph->xaxis->title->SetFont( FF_FONT1, FS_BOLD );
// Display the graph
$graph->Stroke();
?>
-----
