

Bonjour,
J'ai un graphe dont je veux rendre le fond de la zone de traçage transparent. C'est à dire qu'il y a, par défaut, une alternance de bandes, que j'aimerais ne plus voir.
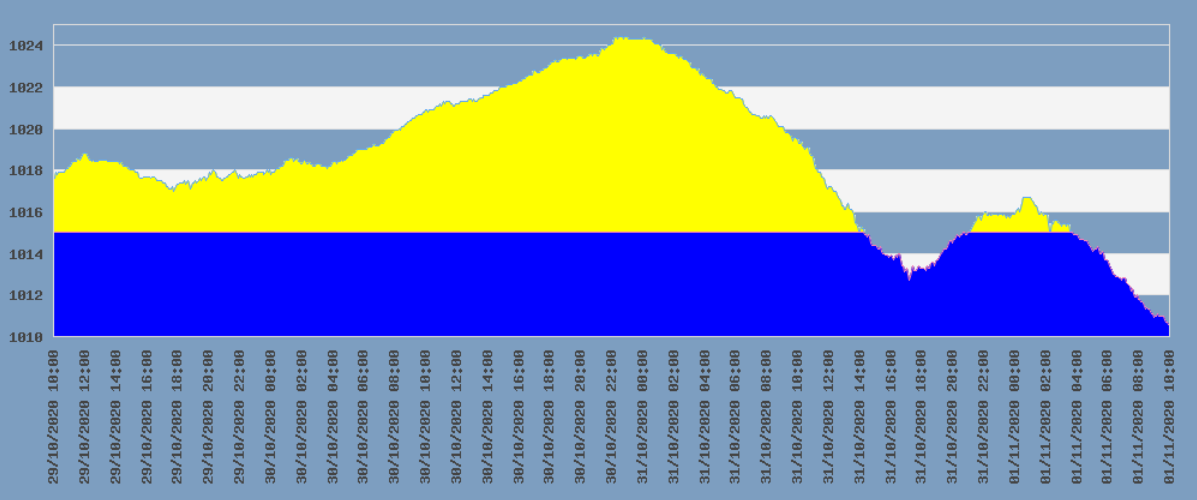
Le fond de ma page est bleu ciel et c'est vraiment moche :
Je me suis dit que cela devrait se passer du côté de la classe plotband, mais je ne la comprends pas trop.
À vous lire,...
Code:<?php // deux courbes Y et dates en X require_once( '../jpgraph/jpgraph.php' ); require_once( '../jpgraph/jpgraph_line.php' ); require_once( '../jpgraph/jpgraph_date.php' ); require_once( '../jpgraph/jpgraph_plotband.php' ); setlocale( LC_ALL, "fr_FR" ); // préparation variables et autres $ws_pr_x = 0; // pression maX $ws_pr_n = 9999; // pression miN $Fichier = file( 'meteo_72h.csv' ); // lecture du fichier for ( $i = 0; $i < 864; $i++ ) { $data = explode( ";", $Fichier[ $i ] ); /* 0 date et heure 1 pression 2 temp 3 hum 4 rain 5 rain rate 6 direction du vent en chiffres 7 idem en lettres 8 vent 9 rafales */ // stockage dates et heures et minutes $ws_dt[ $i ] = strtotime( $data[ 0 ] ); // OK // stockage pressions 2 courbes pour les basses et hautes pressions $data[ 1 ] = str_replace( ",", ".", $data[ 1 ] ); // remplace les virgules par des points // Détermination des pression min et max if ( $ws_pr_x < $data[ 1 ] )$ws_pr_x = $data[ 1 ]; //pression maX if ( $ws_pr_n > $data[ 1 ] )$ws_pr_n = $data[ 1 ]; //pression miN // création des séries, la première, $ws_prb, pour les basses pressions, limitée à 1015 ; la seconde, $ws_prh, pour les hautes pressions if ( $data[ 1 ] > 1015 ) { $ws_prb[ $i ] = 1015; //$ws_prh[ $i ] = $data[ 1 ] - 1015; $ws_prh[ $i ] = $data[ 1 ]; } else { $ws_prb[ $i ] = $data[ 1 ]; $ws_prh[ $i ] = $data[ 1 ]; } } // fin de la lecture du fichier //--------------------------------------------------------------------------- if ( $ws_pr_n > 1015 ) { $ws_pr_n = 1015; }; $ws_pr_n = floor( $ws_pr_n - .4 ); $ws_pr_x = ceil( $ws_pr_x + .4 ); // Create the graph. These two calls are always required $graph = new Graph( 1000, 400 ); //$graph->title->Set('Pression atmosphérique des 72 dernières heures'); //SetScale($aAxisType, $aYMin, $aYMax, $aXMin, $aXMax) $graph->SetScale( "datlin", $ws_pr_n, $ws_pr_x ); $graph->img->SetMargin( 60, 10, 10, 130 ); $graph->SetMarginColor( 'white' ); $graph->SetFrame( false ); $yh = new LinePLot( $ws_prh, $ws_dt ); $yh->SetFillColor( '#ffff00' ); //jaune $yh->SetColor( '#ffff00' ); $graph->Add( $yh ); $yb = new LinePLot( $ws_prb, $ws_dt ); $yb->SetFillColor( '#0000ff' ); //bleu $yb->SetColor( '#0000ff' ); $graph->Add( $yb ); //Set the angle for the labels to 90 degrees $graph->xaxis->SetLabelAngle( 90 ); $graph->xaxis->SetPos( $ws_pr_n ); // The automatic format string for dates can be overridden $graph->xaxis->scale->SetDateFormat( 'd/m/Y H:i' ); // fond, bandes $band = new PlotBand( HORIZONTAL, BAND_SOLID, 1015, 1016, 'black' ); $band->ShowFrame(false); //$band->SetDensity(1); $graph->AddBand( $band ); //transparence $graph->img->SetTransparent( 'white' ); $graph->title->SetFont( FF_FONT1, FS_BOLD ); $graph->yaxis->SetFont( FF_FONT1, FS_BOLD ); $graph->xaxis->SetFont( FF_FONT1, FS_BOLD ); // Display the graph $graph->Stroke(); ?>
-----