
Bonjour,
Je cherche à résoudre deux problèmes via le logiciel Matlab,
Débutant en Matlab, je ne sais pas trop par ou me lancer, je pensais à un fichier springb
Auriez vous des idées ?
Merci d'avance,
cordialement,
Mathieu
-----

Bonjour,
Je cherche à résoudre deux problèmes via le logiciel Matlab,
Débutant en Matlab, je ne sais pas trop par ou me lancer, je pensais à un fichier springb
Auriez vous des idées ?
Merci d'avance,
cordialement,
Mathieu
déjà, on te propose la fonction ode23, commence par regarder ça. Ensuite, l'utilisation de plot pour tracer les courbes devrait suffire dans un premier temps.
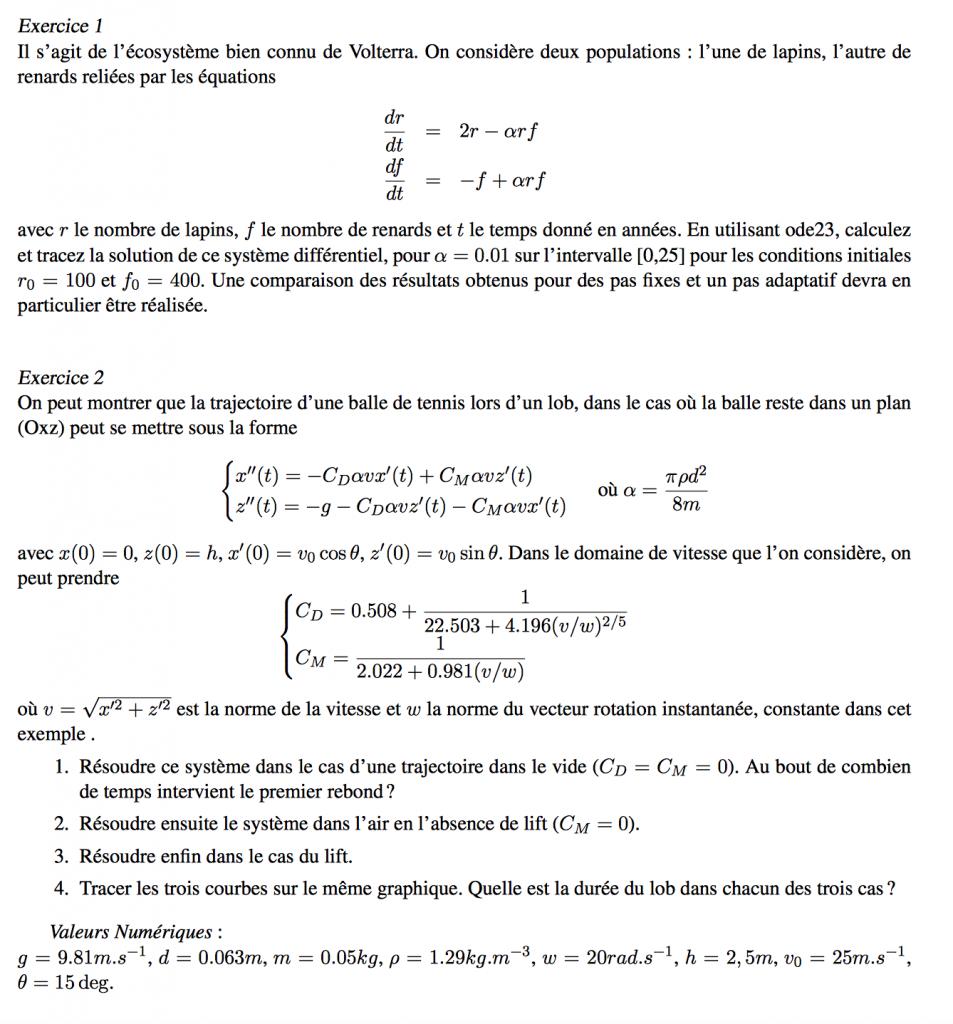
Avec l'aide de Matlab, j'ai quelque chose comme ça pour l'exo 1 :
function yp=springb(t,w) ;
yp(1)*=(2-0,01*y(2))*y(1)
yp(2) =(-1+0,01*y(1))*y(2)
t0*=0*;
tfinal=25*;
y0=[100,400]*;
[t,y]=ode23(@lokta,[t0,tfinal],y0)*;
plot(t,y)*
title(‘Lapin/Renard Population Over Time’)
xlabel(‘t’)*;
ylabel(‘Population’)
legend(‘lapin’,’renard’)
lokta.m
function yp=lokta(t,y)
yp=diag([2-0,01*y(2), -1+ .01*y(1)])*y;
Mais ce n'est apparemment pas encore ça ^^
Pour le premier, j'ai cela :
t0 =0 ;
tfinal=25 ;
y0=[100,400] ;
[t,y]=ode23(@springb,[t0,tfinal],y0)
plot(t,y);
title('Lapin/Renard Population Over Time')
xlabel('t')*
ylabel('Population');
legend('lapin','renard','Locat ion','North');
*
*
Fichier lokta *:
*
function yp = springb(t,y);
alpha = 0.01;
yp = zeros(size(y));
*
yp(1) =(2-alpha*y(2))*y(1);
yp(2) =(-1+alpha*y(1))*y(2);
end
Ca a l'air de bien fonctionner cette fois-ci.
Cependant, pour le deuxième exercice, je ne sais pas trop par où commencer ?
x_z_vac=dsolve('D2x=0', 'D2z=-g', 'x(0)=0', 'Dx(0)=v0*cos(theta*pi/180)', 'z(0)=h', 'Dz(0‡=v0*sin(theta*pi/180)', 't');
xt=x_z_vac.x
zt=x_z_vac.z
g=9.8;
h=1;
theta=15;
v0=25;
xt=vectorioze(xt);
zt=(vectorize(zt));
t=linspace(0,1.5,200);
xt=eval(xt);
zt=eval(zt);
z_i=find(zt==min(abs(zt)));
touch_gr=xt(z_i);
t_touch=t(z_i);
plot(xt, zt), grid on xlim([0, touch, gr])†;
Pour le deuxième pour l'instant, mais je suis bloqué, si quelqu'un a une idée ?