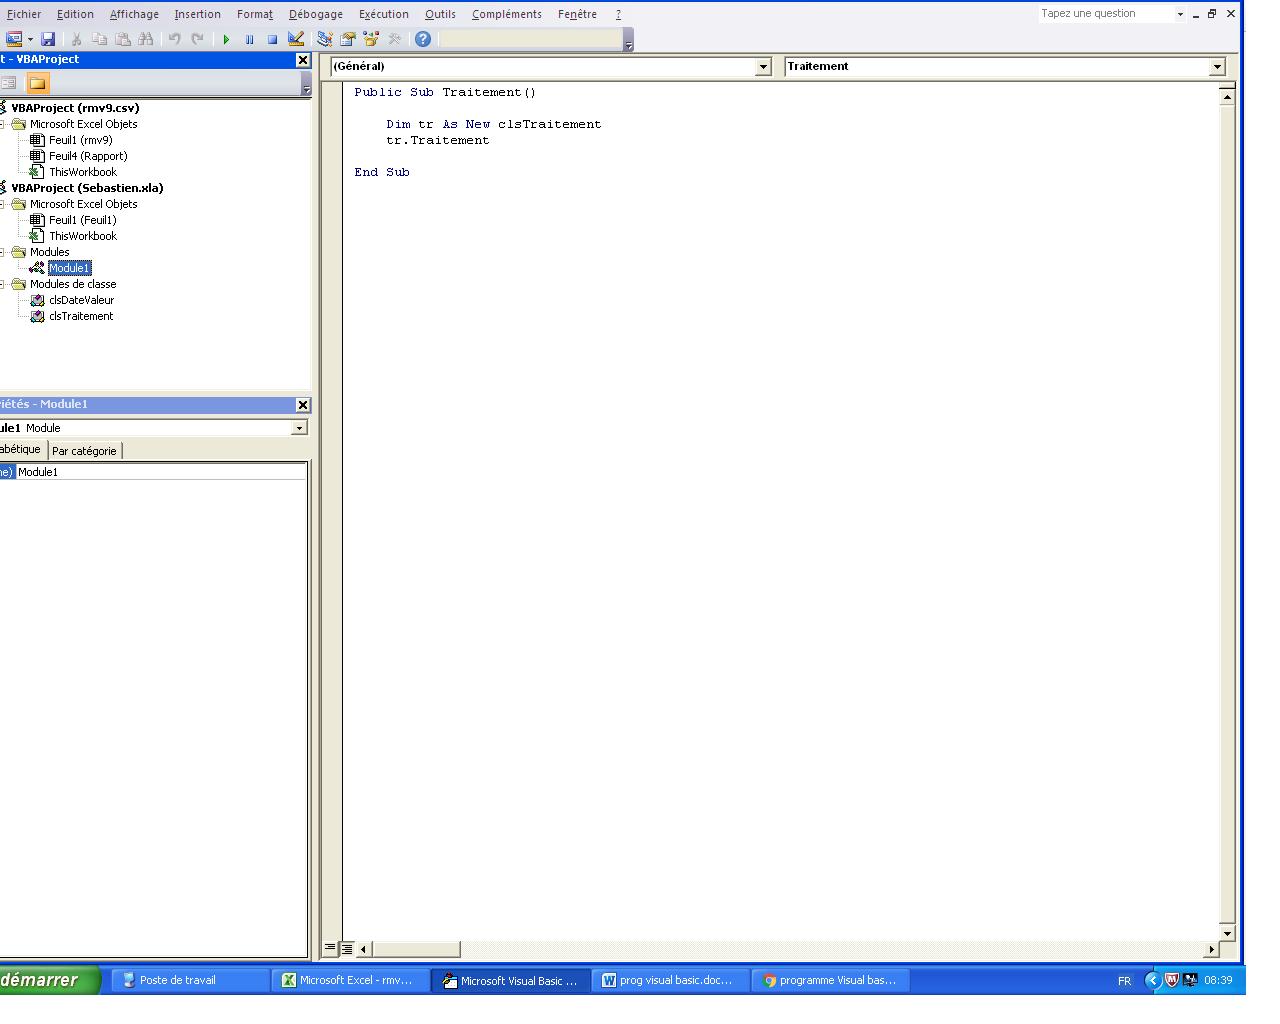
bonjour ,
j'aimerais savoir a quoi correspondent chaque fonction svp merci
Private newPage As Variant
Private collData As New Collection
Private ac As Variant
'''''''''''''''''''''''''''''' '''''''
' Exécution du traitement
Public Sub Traitement()
Call Flush
Call CreatePage("Rapport")
Call GetData(0)
Call PutData
Call CreateChart
Call CreateMoyenne
Call CreateChartMoy
End Sub
'''''''''''''''''''''''''''''' '''''''''
' Suppression des feuilles supplémentaires
Private Sub Flush()
Application.DisplayAlerts = False
Do While ActiveWorkbook.Sheets.Count > 1
Sheets(2).Delete
Loop
Application.DisplayAlerts = True
Set newPage = Nothing
Set collData = New Collection
End Sub
'''''''''''''''''''''''''''''' ''''
' Création d'une page Excel
' Nom : Nom de la page
' Renvoi : void
Private Sub CreatePage(Nom As String)
ActiveWorkbook.Sheets.Add After:=Worksheets(1)
Set newPage = ActiveSheet
newPage.Move After:=Sheets(1)
newPage.Name = Nom
End Sub
'''''''''''''''''''''''''''''' ''''''
' Récupération des données de la page .CSV
' ref : Filtre de récupération
' Renvoi : void
Private Sub GetData(ref As Integer)
Dim i As Integer
Dim dv As clsDateValeur
' On commence à la 4ème ligne
i = 4
' Récupération des données jusqu'à ce qu'il n'y en ait plus
Do While Sheets(1).Cells(i, 1) <> ""
If Sheets(1).Cells(i, 2) = ref Then
Set dv = New clsDateValeur
Call dv.Init(Sheets(1).Cells(i, 1), Sheets(1).Cells(i, 3) * 1000)
collData.Add dv
End If
i = i + 1
Loop
End Sub
'''''''''''''''''''''''''''''' ''''''''''
' Ecriture des données par rapport à une collection de type clsDateValeur
' collData :La collection de données
' Renvoi : <void>
Private Sub PutData()
Dim i As Integer
i = 1
For Each dv In collData
newPage.Cells(i, 1) = dv.dt
newPage.Cells(i, 1).NumberFormat = "h:mm;@"
newPage.Cells(i, 2) = dv.valeur
i = i + 1
Next
End Sub
'''''''''''''''''''''''''''''' ''''''''''''''
' Création du graphique
' maxi : Nbre de valeurs
Private Sub CreateChart()
newPage.Range("E2").Select
newPage.Shapes.AddChart.Select
Set ac = ActiveChart
ac.ChartType = xlXYScatterSmooth
ac.SeriesCollection.NewSeries
ac.SeriesCollection(1).XValues = "=Rapport!$A$1:$A$" & collData.Count
ac.SeriesCollection(1).Values = "=Rapport!$B$1:$B$" & collData.Count
End Sub
Private Sub CreateMoyenne()
Dim moy As Double
If collData.Count < 2 Then Exit Sub
For Each pt In collData
moy = moy + pt.valeur
Next
moy = moy / collData.Count
newPage.Cells(collData.Count + 2, 1) = collData(1).dt
newPage.Cells(collData.Count + 2, 1).NumberFormat = "h:mm;@"
newPage.Cells(collData.Count + 2, 2) = moy
newPage.Cells(collData.Count + 3, 1) = collData(collData.Count).dt
newPage.Cells(collData.Count + 3, 1).NumberFormat = "h:mm;@"
newPage.Cells(collData.Count + 3, 2) = moy
End Sub
Private Sub CreateChartMoy()
ac.SeriesCollection.NewSeries
ac.SeriesCollection(2).XValues = "=Rapport!$A$" & collData.Count + 2 & ":$A$" & collData.Count + 3
ac.SeriesCollection(2).Values = "=Rapport!$B$" & collData.Count + 2 & ":$B$" & collData.Count + 3
End Sub
-----


